
Model
The illustration below shows the internal architecture of the Prometheus Java client library.
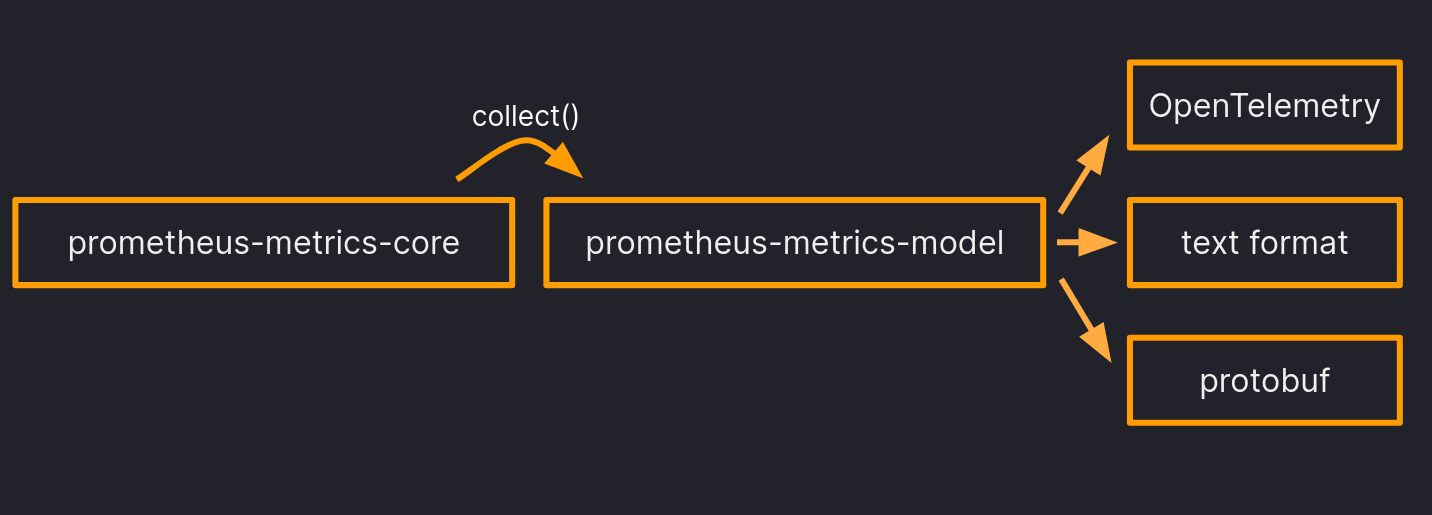
This is the user facing metrics library, implementing the core metric types, like Counter, Gauge Histogram, and so on.
All metric types implement
the Collector interface,
i.e. they provide
a collect()
method to produce snapshots. Implementers expose their registration-time metadata via
getMetricFamilyDescriptor() (or getMetricFamilyDescriptors() on MultiCollector). When that
returns null, the collector is not validated at registration and must avoid producing the same
metric name and label schema as another collector, or exposition may be invalid.
The model is an internal library, implementing read-only immutable snapshots. These snapshots are returned by the Collector.collect() method.
There is no need for users to use prometheus-metrics-model directly. Users should use the API
provided by prometheus-metrics-core, which includes the core metrics as well as callback metrics.
However, maintainers of third-party metrics libraries might want to use prometheus-metrics-model
if they want to add Prometheus exposition formats to their metrics library.
The prometheus-metrics-exposition-formats module converts snapshots to Prometheus exposition
formats, like text format, OpenMetrics text format, or Prometheus protobuf format.
The exporters like prometheus-metrics-exporter-httpserver or
prometheus-metrics-exporter-servlet-jakarta use this to convert snapshots into the right format
depending on the Accept header in the scrape request.